How do you prove marketing ROI with pipeline, not opinions?
If you’re being honest, the question usually shows up at the worst time. Budget season. Board prep. A pipeline shortfall. Someone asks: How to prove marketing ROI without waving around dashboards full of clicks.
Here’s the answer: you prove it by tracking Marketing-generated pipeline at the opportunity level inside your CRM, then using an attribution method that matches how your revenue team actually works. Multi-touch attribution can help, but only if your definitions, timestamps, and reporting rules are consistent.
Now the longer, more useful answer: this is not just an analytics project. It’s a measurement agreement between marketing, sales, and finance. Once that agreement exists, How to connect marketing to revenue becomes a repeatable process, not a quarterly argument.
Trusted reference you can share with leadership: Gartner’s reporting highlights how common it is for marketing leaders to struggle to prove value and receive credit for business outcomes.
Introduction
The old way was simple. Marketing handed over leads, sales handled the “real work,” and everyone pretended the handoff was clean. When revenue was up, marketing claimed brand impact. When revenue was down, marketing got asked for “more leads.”
The new way is more accountable, and honestly more humane. You track what marketing actually influences: opportunity creation, stage movement, and closed-won revenue tied back to campaigns and touchpoints. That’s the heart of Marketing generated pipeline.
The result is what decision-makers care about: a defensible view of pipeline and revenue impact, backed by the CRM, supported by an agreed Marketing attribution model, and expressed in terms of B2B marketing ROI.
This guide is for marketing leaders, RevOps teams, and anyone who’s tired of fuzzy reporting. You’ll learn the definitions that matter, the mechanics behind tracking, and a practical way to report From leads to revenue without overstating what the data can prove.
What is Marketing generated pipeline?
Marketing generated pipeline is the portion of sales pipeline (opportunity value) that can be tied to marketing-originated or marketing-qualified activity, based on agreed rules in your CRM. It moves the conversation from lead volume to opportunity creation and pipeline value, which leadership can compare to spend.
In plain terms, it’s pipeline you can credibly connect to marketing’s work. Sometimes that means marketing “created” the opportunity. Sometimes it means marketing played a measurable role in getting an opportunity opened or advanced.
A lot of teams confuse this with “marketing-sourced pipeline” and stop there. That’s a mistake. Sourced is clean, but narrow. Influenced is broader, but easy to inflate if you’re careless. The stronger approach is to report both, with clear definitions and notes that prevent double-counting panic.
Where it’s used: mostly B2B and longer sales cycles, where multiple stakeholders touch multiple channels before a deal becomes real. That complexity is exactly why single-touch attribution falls short so often.
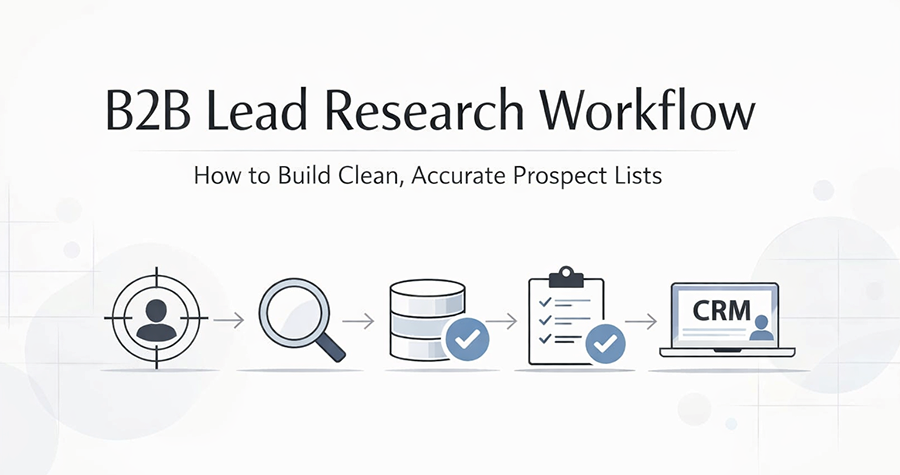
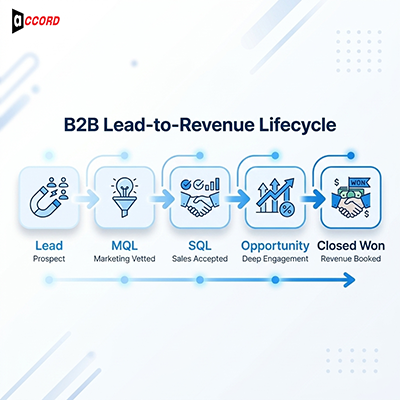
From leads to revenue: the lead to the revenue process explained
Lead to the revenue process explained: a prospect becomes a lead, is qualified into an MQL, accepted into an SQL, converted into an opportunity, then progressed through stages to closed-won revenue. To prove impact, you need timestamps for each milestone and consistent stage definitions so you can calculate conversion rates and velocity.
Most teams say they track this, but what they actually track is “form fills” and “meetings booked.” Helpful, sure. But revenue doesn’t show up because someone downloaded a PDF.
If you want Lead to revenue conversion you can defend, you need a few milestones that both teams respect. Not twenty. Five to seven is usually enough.
Here’s a practical milestone chain that works in most B2B CRMs:
-
Lead created
-
MQL timestamp
-
SQL timestamp
-
Opportunity created timestamp
-
Stage changes (with dates)
-
Closed-won date and revenue amount
When you have that, Pipeline tracking for marketers stops being a guessing game. You can show, for example, which programs create more opportunities, which programs speed up stage movement, and which programs bring in deals that actually close.
How Marketing generated pipeline works
To calculate Marketing generated pipeline, you sum the value of opportunities that match your “marketing-generated” rules for a given period (often by opportunity created date), then segment by source and campaign. The key is that the CRM must store campaign influence, lead source, and milestone timestamps.
Let’s make this concrete.
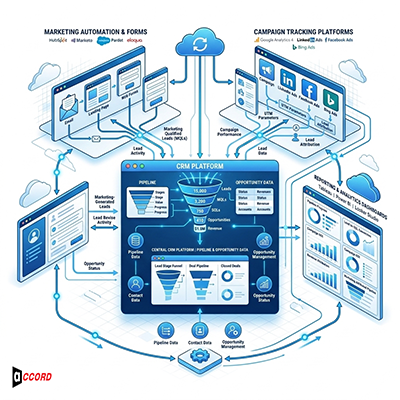
The minimum “architecture”
You need three systems to behave like one:
-
Marketing automation or forms (where the first known touch often happens)
-
CRM (where opportunities and revenue live)
-
A reporting layer (native CRM reports are fine at first)
The failure mode is predictable: campaigns live in the marketing tool, opportunities live in the CRM, and nobody trusts the sync. That’s why so many teams feel stuck trying to prove pipeline.
A simple formula you can explain in a meeting
Marketing-generated pipeline (for a month) =
Sum of opportunity amounts where:
-
Opportunity created in that month, AND
-
Opportunity meets your “marketing-generated” criteria (example criteria below)
Now pick your criteria carefully.
One defensible option:
-
Opportunity created from a contact whose first known source was marketing, OR
-
Opportunity created after a tracked marketing milestone (for example: “requested demo” from a campaign), with a minimum lookback window
This is also where you decide whether you’re reporting sourced, influenced, or a blended view. Many teams report both.
Choosing a Marketing attribution model that finance won’t roll their eyes at
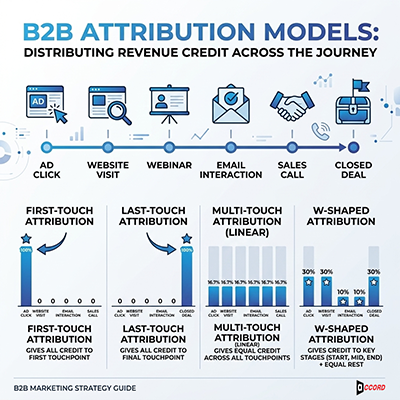
A Marketing attribution model assigns credit for pipeline or revenue across touchpoints. In B2B, multi-touch models are usually more realistic than first-touch or last-touch because buying journeys include multiple channels and stakeholders. The best model is the one your team can implement consistently and explain clearly.
Let’s be real. Attribution is political because it decides who “gets credit.” That’s why you want a model that reduces debate, not one that creates endless spreadsheet fights.
Common models you’ll see:
-
First-touch and last-touch: simple, but they flatten the journey and often mislead.
-
Multi-touch: spreads credit across interactions and gives a fuller view, but requires disciplined tracking.
-
W-shaped: weights three milestones heavily (often first touch, lead creation, opportunity creation) and can map well to B2B stages.
A useful caution from Forrester: multi-touch attribution can be misused if teams treat model output like exact “return value” per tactic, rather than directional insight for planning.
My take: if you’re early, start with a simple multi-touch model or W-shaped, run it consistently for 60 to 90 days, and focus on trend direction. Not perfection.
Also, write down one sentence your CFO will appreciate: “This model estimates contribution, not ownership.” That one line defuses a lot of meetings.
The reporting layer: CRM pipeline reporting that people will trust
Reliable CRM pipeline reporting requires clean opportunity fields (amount, stage, close date), standardized lead and contact sources, and consistent campaign association rules. Your dashboard should separate sourced vs influenced pipeline, show conversion rates between milestones, and include data quality checks (like missing campaign IDs or undefined lifecycle stages).
This is where many blogs stop at “use your CRM.” But the devil is in the fields.
If you want a reporting pack executives will actually use, build three views:
-
Pipeline created (marketing-sourced and marketing-influenced)
-
Pipeline velocity (time from MQL to SQL, SQL to opp, opp to close)
-
Revenue outcomes (closed-won, ASP, win rate, CAC payback if you can)
Here’s the one thing I rarely hear said out loud: data quality is part of marketing performance. If campaigns aren’t consistently mapped, your best program might look average, and your average program might look great.
A simple text table for your monthly exec deck
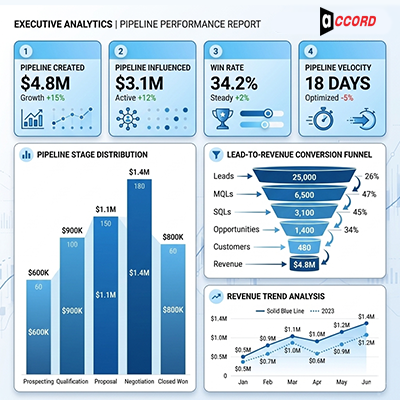
Marketing KPIs for executives that connect to money

Marketing KPIs for executives should show pipeline created, pipeline influenced, conversion rates across milestones, and revenue outcomes, all tied to spend. Executives typically care less about traffic and more about pipeline value, velocity, win rate, and forecasting confidence because those metrics affect revenue planning.
Use KPIs that force clarity. Not just “activity.”
Here are the few I’d defend in a leadership meeting:
-
B2B marketing ROI (pipeline and revenue per dollar, by quarter)
-
How to track marketing pipeline (pipeline created, influenced, and stage movement)
-
Marketing revenue attribution (model used, lookback window, and limits)
-
Lead to revenue conversion rates (MQL→SQL, SQL→Opp, Opp→Won)
-
Pipeline velocity (median days between milestones)
The point is not to shame anyone with numbers. It’s to create a shared view so spend decisions feel rational instead of emotional.
The kind that happens every quarter
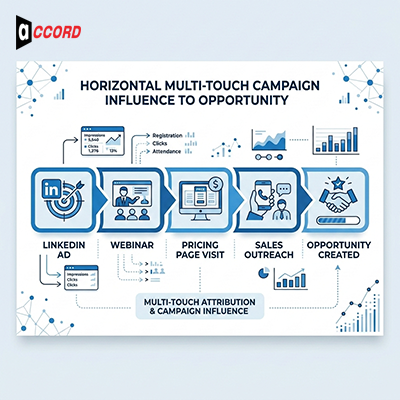
Let’s say you run a webinar for mid-market IT directors. The webinar gets 300 signups. Sales says, “Cute, but none of those are buying.”
Two months later, three deals show up in pipeline. Each deal has multiple touches: a LinkedIn ad, the webinar, a pricing page visit, then a sales outbound sequence.
If you only use first-touch, you’ll credit LinkedIn ads. If you only use last-touch, you’ll credit sales outbound. Either way, the webinar looks useless.
But with a sensible Marketing attribution model (multi-touch or W-shaped) and clean campaign association, the webinar becomes visible as a mid-funnel accelerant. That’s a different story: not “webinar generated revenue,” but “webinar moved specific accounts to opportunity creation faster.”
That distinction matters. It’s what Revenue driven marketing looks like when you’re not pretending attribution is magic.
Why Marketing generated pipeline matters now
Marketing generated pipeline matters because budget decisions increasingly require revenue-grade proof, not lead volume. Without pipeline-level tracking, marketing gets optimized for easy-to-count metrics instead of business outcomes, which can reduce deal quality, slow the funnel, and create conflict between teams over what “worked.”
The risk isn’t just losing budget. It’s steering the business with the wrong instrument panel.
If you only report leads, you’ll bias toward low-intent conversions that look good on paper. Then sales ignores them. Then marketing pushes harder. Then the relationship gets weird.
The healthier loop is: define pipeline impact, measure it consistently, and use it to improve your Pipeline building system over time.
How to stay honest
A few realities you should say out loud in your reporting notes:
-
B2B journeys are multi-stakeholder, and not every touch is trackable.
-
CRM data is often incomplete without governance and enforcement.
-
Even strong multi-touch models can be misread as exact ROI per channel.
When you can’t confirm something, say so. Literally.
“This appears to be unverified or misleading information, and no official sources confirm its authenticity.”
That line belongs in your measurement culture, not just in cybersecurity. It’s how you keep trust when data is imperfect.
Also, a quick nod to privacy and fragmentation: modern attribution is harder when data is split across platforms and tracking changes over time. Many teams are feeling that pressure.
Common misconceptions
“If marketing influenced it, marketing owns it.”
Reality: Influence is about visibility, not ownership. Report influenced pipeline, but label it carefully so leaders don’t think you’re double-counting.
“Attribution will solve alignment.”
Reality: Attribution helps, but Sales and marketing alignment comes from shared definitions, shared SLAs, and shared reviews. Tools won’t fix a disagreement about what “qualified” means.
“We need perfect data before we start.”
Reality: You need consistent data, not perfect data. Start with a defensible baseline, audit it weekly, and improve your Data driven growth marketing over time.
What to do now
You don’t need a massive rebuild. You need a disciplined setup and a weekly habit.
plan:
-
Week 1: Define stages, MQL, SQL, and opportunity creation rules (write it down)
-
Week 2: Implement required fields and campaign association rules in the CRM
-
Week 3: Launch baseline dashboards for CRM pipeline reporting
-
Week 4: Run a pipeline review with sales, document disputes, tighten rules
If you already work with a lead generation Services Agency, involve them in tagging standards and campaign mapping. Otherwise you’ll spend months untangling “misc campaign” data.
The end goal is a Performance marketing framework that can scale. Not a heroic spreadsheet built by one person at midnight.
Campaign impact by stage
This kind of view makes How to track marketing pipeline feel tangible.
practical recommendations
Accord Tech Solutions usually sees the same blockers when teams try to prove Marketing generated pipeline: missing definitions, campaign mapping drift, and inconsistent handoffs.
Recommendations that tend to hold up in the real world:
-
Keep a single source of truth in the CRM for lifecycle stage and opportunity dates.
-
Report sourced and influenced pipeline side-by-side, with a plain-language disclaimer about overlap.
-
Start with a simple attribution approach, then evolve once your data hygiene is steady.
-
Treat pipeline reviews as a routine, not a quarterly fire drill.
That’s how you build a Scalable lead generation engine that leadership trusts.
Future implications
Pipeline proof is moving closer to finance-grade reporting. More teams are adopting multi-touch attribution concepts, but they’re also being more cautious about overclaiming.
The teams that win will be the ones who can say, calmly and clearly:
-
Here’s what we can measure.
-
Here’s what we estimate.
-
Here’s how we’ll improve the measurement next quarter.
That posture is underrated. It’s also persuasive.
Conclusion: the calm way to prove pipeline and revenue impact
If you want Marketing generated pipeline to be taken seriously, treat it like a shared operating metric, not a marketing trophy.
Get your definitions straight. Build reporting around opportunities, not leads. Pick a Marketing attribution model you can explain in one minute. Then show the story of From leads to revenue with conversion rates, velocity, and outcomes.
That is Revenue focused lead generation in practice. Quietly measurable. Repeatable. Worth investing in. If you want, Accord Tech Solutions can share a simple template for a pipeline scorecard and the CRM field checklist many teams use as a starting point. Use it to pressure-test your current reporting before you invest in new tools.