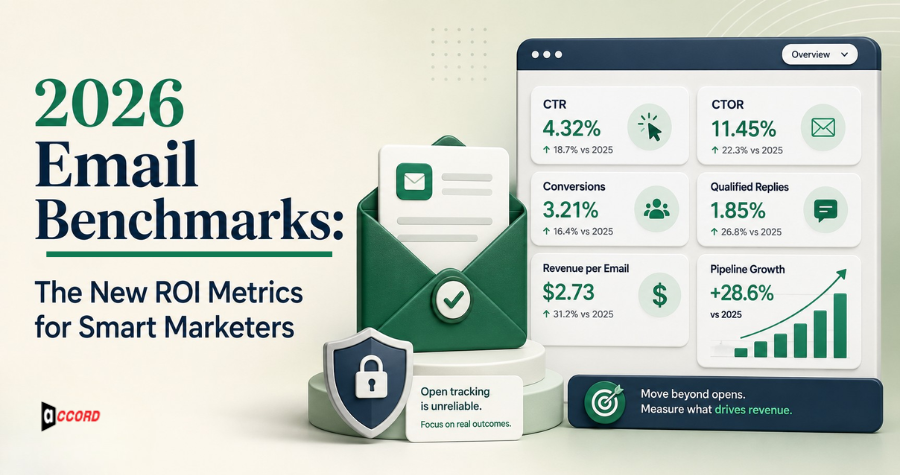
The email marketing benchmarks that matter in 2026 are inbox placement, click-through rate (CTR), click-to-open rate (CTOR), conversion rate, qualified reply rate, revenue per delivered email, pipeline contribution, bounce rate, and spam complaint rate. Open rate remains a directional diagnostic, but privacy features and image preloading make it too noisy to serve as the headline ROI metric.
Featured-image dashboard values are illustrative, not industry benchmark claims; the sourced reference figures used in this guide appear in the sections below.
That shift matters most for B2B companies, SaaS teams, and startups that are accountable for pipeline rather than activity. A campaign can report a strong open rate and still generate few qualified conversations or sales. The practical goal is therefore not to chase one universal percentage. It is to compare each campaign with a relevant external benchmark, establish an internal baseline by audience and campaign type, and connect engagement data to business outcomes.
This guide explains which email marketing metrics deserve attention in 2026, how to calculate them, which published benchmarks provide useful context, and how to build a reporting dashboard that leads from delivery to revenue.
How Has the Email Performance Landscape Changed in 2026?
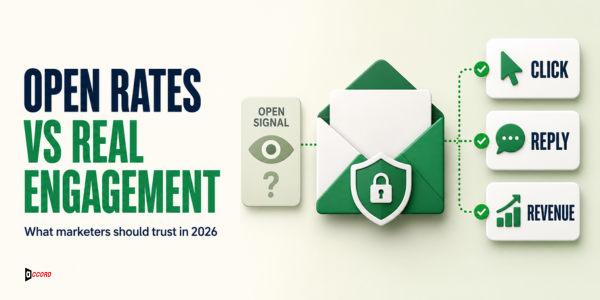
Email measurement has moved further down the funnel. Opens can help diagnose subject lines and tracking trends, but clicks, replies, conversions, pipeline, and revenue provide stronger evidence that a recipient took a meaningful action.
Why Are Open Rates No Longer the Main ROI Metric?
Most open tracking depends on a small image pixel. Apple Mail Privacy Protection can download remote content in the background when a message is received instead of when the recipient reads it. Apple explains that the feature prevents senders from learning whether a message was opened. As a result, a reported open can reflect automated content loading rather than human attention.
The effect is visible in published benchmark data. HubSpot's 2025 roundup reported a 42.35% cross-industry average open rate and cited a study of more than 80,000 accounts in which reported opens rose by roughly 18 percentage points after Mail Privacy Protection. Those figures are useful context, but they should not be treated as proof that nearly half of recipients actively read a campaign.
Open rate is also not the same as deliverability. A delivery event means the receiving server accepted the message; inbox placement asks whether it reached the inbox rather than spam or went missing; an open event depends on content loading and the recipient's mail client. Treating these as separate stages prevents a strong-looking open rate from hiding a placement or conversion problem.
How Does B2B Buyer Behavior Change Email Performance?
B2B buyers often evaluate a vendor across several touchpoints before they reply or book a meeting. They may visit a service page, read a case study, compare alternatives, return through a retargeting ad, and respond to an email days later. Email is therefore part of a wider decision journey rather than an isolated one-send event.
This makes qualified replies more informative than raw opens for sales-led programs. A reply is a deliberate action, although it still needs classification: a positive response from a decision-maker is more valuable than an automatic reply or an unsubscribe request. Reporting should distinguish positive replies, neutral replies, objections, referrals, and negative responses instead of presenting one undifferentiated reply rate.
Which Email ROI Metrics Matter Beyond Vanity Numbers?
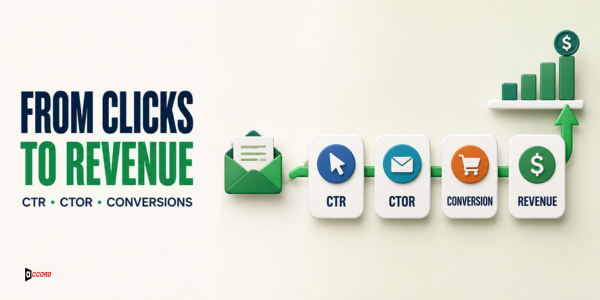
A useful email dashboard separates attention, action, and business impact. CTR and CTOR describe interaction with the message, conversion rate describes completion of the next step, and revenue or pipeline metrics show whether the campaign contributed commercial value.
What Do CTR, CTOR, and Conversion Rate Measure?
- Click-through rate (CTR) = unique recipients who clicked ÷ delivered emails × 100. It reflects the combined effect of targeting, subject line, message, offer, and call to action.
- Click-to-open rate (CTOR) = unique recipients who clicked ÷ unique recorded opens × 100. It can help compare content engagement among recorded openers when the audience, mail-client mix, and tracking method are similar.
- Email conversion rate = recipients who completed the intended action ÷ delivered emails × 100. Some analytics platforms instead divide conversions by clicks, so every dashboard should state its denominator.
Mailchimp's currently published benchmark data, accessed in 2026, lists a 2.66% average CTR across its dataset and a range of roughly 1% to 5% by industry. That is a reference point, not a universal target. Campaign type, audience permission, offer, industry, and the platform's calculation method can all change the result.
CTOR also needs a privacy caveat. Because its denominator is recorded opens, automated image loading can inflate the denominator and depress CTOR. It does not remove Mail Privacy Protection noise. Use CTOR for like-for-like trend analysis inside the same program, and rely on clicks, conversions, qualified replies, and revenue for stronger outcome reporting.
A three-metric diagnostic is often more useful than a single score:
- If delivery is stable but CTR falls, investigate targeting, the subject line, the offer, or the call to action.
- If CTR is healthy but conversion rate falls, inspect the landing page, form, offer-message match, and mobile experience.
- If conversions rise but attributed revenue does not, review lead quality, sales follow-up, deal stages, and attribution rules.
Why Do Revenue per Email and Email ROI Show Campaign Value?
Revenue per delivered email connects a campaign to the value it produced, while email ROI compares attributable profit or revenue with the total cost of the program. Both are more decision-ready than open rate because they use a business outcome as the numerator.
Use consistent formulas and document them:
- Revenue per delivered email = attributable email revenue ÷ delivered emails.
- Email ROI = (attributable email revenue − email program cost) ÷ email program cost × 100.
- Pipeline per delivered email = email-attributed pipeline value ÷ delivered emails.
Reliable attribution requires campaign-level UTM parameters, consistent CRM campaign fields, defined lifecycle stages, and an agreed attribution model. A first-touch model credits the campaign that introduced the lead; a last-touch model credits the final recorded interaction; a multi-touch model distributes credit across several interactions. The right choice depends on the sales cycle, but changing models between reports makes comparisons unreliable.
Litmus's current email ROI guide, accessed in 2026, reports an average return of $36 for every $1 spent. Treat that as a broad industry reference rather than a forecast for a specific company. List quality, product economics, attribution rules, campaign mix, and program cost can move the result substantially.
How Should Marketers Measure Email Marketing ROI in 2026?
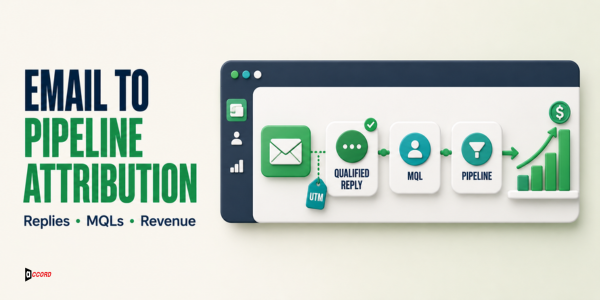
Start with a measurement chain that connects delivery to qualified pipeline: delivered email → verified engagement → intended conversion → qualified lead or conversation → opportunity → revenue. Each stage should have a defined event, owner, denominator, and data source.
How Do You Track Leads, Replies, and Qualified Conversations?
Configure the CRM to store the original campaign, UTM values, campaign membership, reply classification, lifecycle stage, and opportunity association. For sales-led email, keep reply metrics separate from click metrics. A prospect may reply without clicking, and that response can be the campaign's most valuable action.
Report at least three reply measures:
- Total reply rate: all human replies ÷ delivered emails.
- Positive reply rate: interested or referral replies ÷ delivered emails.
- Qualified conversation rate: replies that meet the agreed fit and intent criteria ÷ delivered emails.
This prevents a high reply count from masking low lead quality. The qualification rule should be written before the campaign starts—for example, target role, company profile, expressed need, and willingness to take a next step.
Why Does Pipeline Contribution Matter More Than Email Volume?
Send volume is an input, not an outcome. Doubling volume can create more opportunities, but it can also increase bounces, complaints, fatigue, and low-quality replies if targeting does not improve. Pipeline contribution shows whether additional sending created commercially relevant demand.
Segment pipeline reporting by audience, offer, campaign type, and sales stage. A smaller account-based segment may generate fewer clicks but more qualified opportunities than a broad newsletter. Comparing those segments on CTR alone would undervalue the campaign that produced stronger revenue potential.
Which Email Deliverability Metrics Should Marketers Monitor?
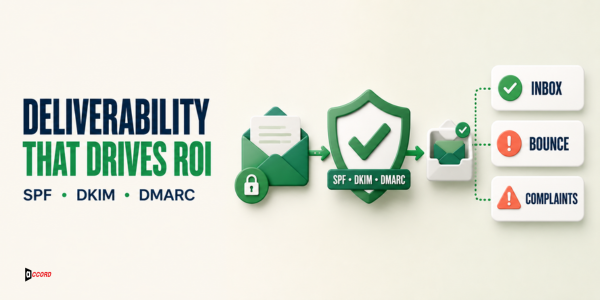
Monitor delivery rate, inbox placement, hard and soft bounce rates, user-reported spam rate, unsubscribe rate, authentication status, and sender reputation. Engagement and ROI metrics cannot perform if the intended audience does not receive the message in the inbox.
Validity's 2025 Email Deliverability Benchmark Report measured global inbox placement at 83.5%, with 6.7% placed in spam and 9.8% missing. In that dataset, roughly one in six messages did not reach the inbox. Because the figures vary by region, provider, industry, and sender, use them as external context and measure the actual placement of your own streams.
Mailgun's 2026 Email Impact Report recommends investigating when bounce rate climbs above 2%. Separate hard bounces from temporary soft bounces, suppress invalid addresses promptly, and examine acquisition sources or segments responsible for the increase.
Google's current sender guidelines advise keeping the user-reported spam rate in Postmaster Tools below 0.1% and avoiding 0.3% or higher. Google also requires bulk senders to personal Gmail accounts to use SPF, DKIM, and DMARC, support one-click unsubscribe for marketing messages, and meet related alignment and infrastructure requirements. Authentication is therefore a baseline control, not an optional optimization.
How Can Smart Marketers Improve Email Campaign Performance?
Use Segmentation to Match Message and Context
Segment audiences using factors that change what a recipient needs: lifecycle stage, firmographic fit, product usage, previous engagement, geography, and buying intent. A cold prospect may need an educational proof point, while an active evaluator may need a relevant case study or a low-friction meeting invitation.
Review performance by segment rather than only at account level. A healthy overall CTR can conceal a high-value segment that is declining, while a weak aggregate open rate can hide a small audience producing strong pipeline.
Personalize for Relevance, Not Decoration
A first-name token is not a strategy. Useful personalization reflects a recipient's role, company situation, funnel stage, previous action, or stated interest. The message should make clear why the content or offer is relevant now without relying on private or intrusive data.
Test one meaningful variable at a time and define the expected outcome before launch. Subject-line tests can use a directional engagement measure, but offer, CTA, and landing-page tests should be judged on clicks, conversions, qualified replies, or revenue.
Use One Clear Primary Call to Action
Give each email one primary next step. Supporting links may still be appropriate, but the visual and written hierarchy should make the intended action obvious. Use specific language such as “Book a 15-minute audit” or “View the benchmark report,” and make sure the landing experience fulfils the promise made in the message.
Key Email Benchmarks to Track in 2026
The table below combines published external references with recommended internal measures. It is not a single universal scorecard: each source uses its own audience, data window, and calculation method. Use the figures to investigate gaps, then set targets from your own comparable campaign history.
| Metric | Published reference or working rule | How to use it |
|---|---|---|
| Open rate | 34.23% in Mailchimp's currently published cross-industry dataset, accessed 2026 | Use directionally within a consistent audience and tracking environment; do not present it as ROI or inbox placement. |
| Click-through rate | 2.66% average; roughly 1%–5% by industry in Mailchimp's published data, accessed 2026 | Compare like-for-like campaigns and check the platform's denominator. |
| Click-to-open rate | No universal target recommended | Use an internal baseline because privacy preloading can distort the open denominator. |
| Conversion rate | No universal target recommended | Define the conversion and denominator, then benchmark by offer and campaign type. |
| Qualified reply rate | Internal baseline by audience and campaign type | Classify replies and report positive, qualified, neutral, and negative outcomes separately. |
| Inbox placement | 83.5% global average in Validity's 2025 benchmark study | Test actual placement by provider and region; delivery rate alone cannot show inbox versus spam. |
| Bounce rate | Investigate above 2%, according to Mailgun's 2026 Email Impact Report | Separate hard and soft bounces, suppress invalid addresses, and audit list sources. |
| User-reported spam rate | Keep below 0.1% and avoid 0.3% or higher, per current Gmail guidance | Monitor in Postmaster Tools and review consent, targeting, frequency, and unsubscribe handling. |
| Email ROI | $36 for every $1 spent in Litmus's current industry guide, accessed 2026 | Treat as broad context; calculate your result with documented revenue, costs, and attribution rules. |
How Does Accord Tech Solutions Help USA Businesses Improve Email ROI?
Accord Tech Solutions helps B2B companies connect email deliverability, segmentation, campaign execution, and CRM attribution to qualified conversations and pipeline. The work begins with the measurement and sending foundation before moving into ongoing optimization.
A typical engagement can include:
- auditing domain authentication, inbox placement, list health, and current reporting;
- segmenting audiences by fit, behavior, and lifecycle stage;
- building campaign and UTM conventions that connect email activity to the CRM;
- testing subject lines, message angles, offers, and calls to action against defined outcomes; and
- reporting qualified replies, meetings, pipeline, and revenue alongside deliverability health.
Explore Accord Tech Solutions' B2B email marketing services in the USA to see the deliverability, campaign, and reporting workflow. If you need a review of your current benchmark dashboard, request an email marketing consultation.
What Should Marketers Do Next?
Rebuild the dashboard around a measurement chain rather than a single headline rate. Keep open rate as a diagnostic, establish internal baselines for CTOR and conversion, and make qualified replies, pipeline, revenue per delivered email, and ROI the measures that decide which campaigns scale.
- Document the formula and denominator for every metric.
- Standardize campaign names, UTM parameters, CRM fields, and reply classifications.
- Separate deliverability health from engagement and commercial outcomes.
- Compare campaigns only when audience, goal, and measurement method are genuinely similar.
- Review trends monthly and investigate sudden changes by segment, provider, and funnel stage.
The most useful benchmark is not the largest number in an industry report. It is a comparable reference that helps the team find a problem, choose an action, and measure whether the action improved a business outcome.
Methodology and Sources
This article was reviewed on August 11, 2026. Published figures are labeled with their source year or access year, and cross-source numbers are presented as contextual references rather than one combined industry standard.
- Apple Support: Protect email privacy in Mail (current documentation, accessed 2026)
- HubSpot: Email marketing benchmarks by industry (2025 benchmark roundup)
- Mailchimp: Email marketing benchmarks and industry statistics (current published dataset, accessed 2026)
- Litmus: Email marketing ROI guide (current guide, accessed 2026)
- Validity: 2025 Email Deliverability Benchmark Report (2025)
- Mailgun: 2026 Email Impact Report—email benchmarks (2026)
- Google: Email sender guidelines (current documentation, accessed 2026)
Frequently Asked Questions
What are email marketing benchmarks?
Email marketing benchmarks are reference figures used to compare campaign performance by metric, industry, audience, or campaign type. They are diagnostic context rather than guaranteed targets. The most useful comparison combines a relevant external benchmark with the organization's own historical baseline.
What is a good email click-through rate in 2026?
Mailchimp's currently published data, accessed in 2026, reports an average CTR of 2.66% and a range of roughly 1% to 5% by industry. A good result should also beat a comparable internal baseline and produce the intended conversion, qualified reply, pipeline, or revenue outcome.
Why are open rates no longer enough?
Open rates rely on image loading, which privacy features and mail clients can trigger without a person reading the message. Opens can still provide a directional trend in a consistent environment, but they do not prove inbox placement, interest, conversion, or revenue.
What is a good CTOR for a B2B email campaign?
There is no reliable universal CTOR target for every B2B campaign. Industry, audience, message type, and privacy-driven open inflation affect the result. Establish a baseline using comparable campaigns, track its direction, and evaluate it alongside clicks, conversions, and qualified replies.
How do you calculate email marketing ROI?
Subtract total email program cost from attributable email revenue, divide the result by total email program cost, and multiply by 100. Document which costs and attribution model are included so the result can be compared consistently over time.
Which email marketing metrics matter most in 2026?
Prioritize inbox placement, CTR, conversion rate, qualified reply rate, revenue per delivered email, pipeline contribution, email ROI, bounce rate, and spam complaint rate. Use open rate and CTOR as supporting diagnostics, with clear privacy and denominator caveats.