
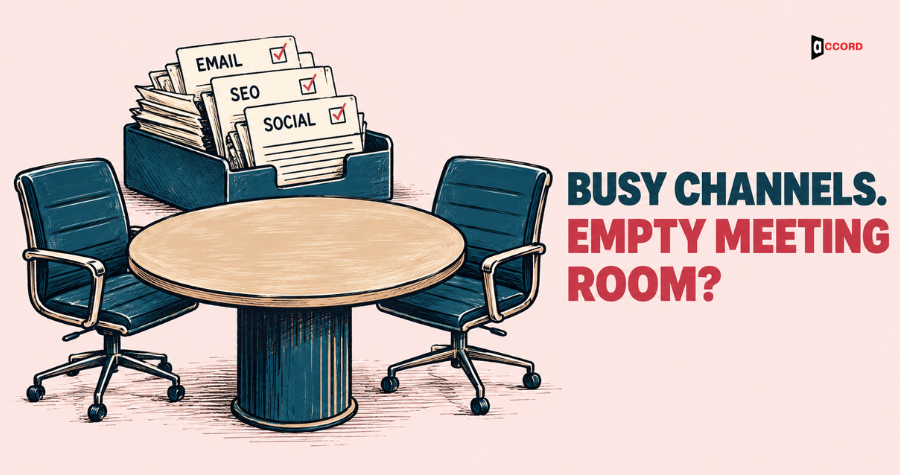
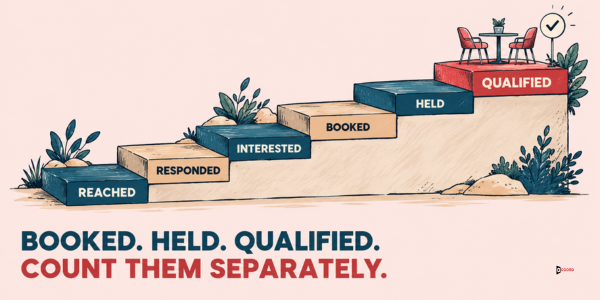
If every channel report looks healthy and sales meetings are still flat, the problem may sit between the report and the calendar, and six numbers can show you where. The email report counts replies. The SEO report counts visits. The social report counts followers. None of them counts a meeting that actually took place. The fix starts with one afternoon of counting: write down the same six numbers every month, from the first contact to a qualified meeting held, and find the stage where the most buyers drop out. Then fix that one stage and leave the rest alone until you count again. You need a spreadsheet, last month's inbox and calendar, and a phone for one test.
Why can every channel report look healthy while sales meetings stay flat?
Each report is built around what its own channel produces: emails sent, replies, impressions, sessions, form fills, followers. Those are activity numbers. They are real, and they are useful for running the channel, but they stop at the edge of the channel. A buyer who replies to a cold email leaves the email report the moment the reply lands. What happens next belongs to nobody's report. When meetings stay flat, the channel reports cannot tell you which stage is leaking, because none of them was built to look past its own edge.
Three things to look for behind a flat meeting count:
- The reports stop at different points. Email stops at the reply, SEO stops at the visit, the website stops at the form fill. No report follows a person to the calendar.
- Different people own each report. An agency, a tool, an intern and a founder may each send a monthly summary. Nobody adds them together.
- The meeting itself is not counted. Counting meetings booked is easy. Counting meetings held takes a calendar check, and counting qualified ones takes a written definition. The number a sales leader cares about most is meetings held with a buyer who fits the target customer, and none of the channel reports above includes it.
A meeting is not revenue, but it is a business opportunity, and it is the first moment a buyer spends real time with you. Until one is held, the numbers you track describe activity and not an opportunity.
Which six numbers should you track every month?
Use one spreadsheet with one sheet per source of buyers. Outbound sources are cold email and outreach. Inbound sources are your website, LinkedIn and social, and referrals. Count unique people, not activity. If you send one person four emails, that is one person and four emails. If a visitor submits the form twice, that is one person and two submissions. Keep the activity counts in a side column, because they help diagnosis, but do not mix them into the six numbers.
Count by hand the first month. Hand counting is slow, but it forces you to open the inbox and the calendar, and that is where the leaks show.
| # | Number | Plain definition (count each person once per month) | Where to find it |
|---|---|---|---|
| 1 | People contacted (outbound only) | Unique people you reached out to for the first time | Sending tool, CRM |
| 2 | People who replied (outbound only) | Unique people who sent any human reply | Inbox |
| 3 | Positive responses | People who asked for times, price, details or a call. For outbound this is a positive reply. For inbound it is the request itself: a form fill, a DM or a call asking for contact | Inbox, form log, DMs, tagged by hand |
| 4 | Meetings booked | On the calendar | Calendar |
| 5 | Meetings held | The meeting happened and nobody was a no-show | Calendar plus meeting notes |
| 6 | Qualified meetings held | Held with a person who can buy, at a company that fits your ideal customer | Your written definition |
Inbound sources start at row 3. A person who fills in a form and asks for a call has already made a positive request, so there is no cold contact or reply to count. Visits, impressions and emails sent are activity, so they go in the side column. How fast you answered an inbound request is a response-speed check, covered below, and not a seventh stage.
Write the definition of "qualified" before you count; the next section shows how.
How do you write the definition of a qualified meeting?
Write it as three rules and one exception, and keep it short enough to fit on a sticky note. Here is an example for a firm that sells to mid-sized companies. Replace every bracket with your own answer:
- Company: [50 to 500] employees, in [two or three industries you serve], in [the countries you sell to].
- Person: someone in [a named list of roles] who can sign or strongly influence the decision.
- Need: the person described a problem your service solves, in their own words, during the call.
- Exception: a meeting with a smaller company counts when a referral or an existing customer introduced it, and the person marks it as an exception in the CRM.
The exception rule makes edge cases visible, so they can be counted separately instead of argued about in the monthly review. Ask the person who ran the meeting to tick "qualified" or "not qualified" within a day. Marketing should not tick the box for sales.
How do you follow the same people from one month to the next?
A reply in October can become a meeting in November. If you divide November's meetings by November's replies, you compare two different groups of people, and the rates drift in ways that mean nothing. Follow the same group instead.
Tag each person with the month of their first positive response. Call that group a cohort. Each month, go back to the earlier cohorts and update them with the meetings booked, held and qualified so far. Wait until a cohort is old enough for most of its meetings to have happened before you treat its rates as final. Set that window from your own sales cycle, for example 45 or 60 days. In the first two months your cohorts will be partial, so read them as early signals and not as verdicts.
This takes one extra column in the sheet: "month of first positive response."
Who should own the monthly count?
One person owns the count, and that person should not be the one whose channel is being counted. A sales manager, a founder or an operations lead is a good choice. Their job is small: collect the numbers by the fifth of each month, keep the definition at the top of the sheet, and name an owner for the stage with the biggest loss. If agencies or freelancers work for you, ask each of them to fill in only the rows their channel touches, using the same sheet and the same definition.
How do you read the six numbers?
Divide each number by the one before it. The result is the share of people in the cohort who made it to the next stage.
Imagine a 40-person compliance consultancy that sells to mid-sized logistics firms. Every figure in this example, including the details in the paragraphs that follow the tables, is invented to show the method. None of it is a benchmark.
The consultancy follows its October cold email cohort and counts it on 30 November:
| Stage | October cohort, counted on 30 November | Share who moved on |
|---|---|---|
| People contacted | 1,200 | n/a |
| People who replied | 48 | 4% |
| Positive responses | 21 | 44% of replies |
| Meetings booked | 12 | 57% of positive responses |
| Meetings held | 8 | 67% of booked |
| Qualified meetings held | 5 | 63% of held |
The email report shows a 4% reply rate and a healthy list, so the vendor calls the month a success. The six numbers tell a different story. Twenty-one people said yes, and only 12 became meetings. Nine buyers who raised a hand were lost after the reply, and the vendor report never shows that loss.
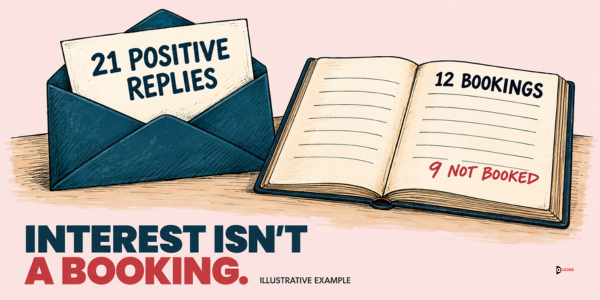
Start at the stage closest to the meeting. A positive response has already said yes, so losing one costs you more than losing a cold contact. Losing 9 of 21 positive responses is a bigger problem than adding another 500 contacts to the list. When the consultancy opens the nine email threads, it finds that six of them needed three or more messages to agree on a time, and the buyer went quiet somewhere in the middle. The fix is small: the first reply offers two specific time slots and a booking link. Nothing new is bought, and the November cohort shows whether the loss shrank.
The same method works for inbound sources, which start at row 3. Imagine the consultancy's website produces 14 unique people who asked for contact in October, and 900 visits to the service pages. The visits go in the activity column. The 14 people become the first row of the inbound sheet:
| Stage | October website cohort | Share who moved on |
|---|---|---|
| Positive responses (requests for contact) | 14 | n/a |
| Meetings booked | 4 | 29% |
| Meetings held | 3 | 75% of booked |
| Qualified meetings held | 2 | 67% of held |
Only 4 of 14 people who asked for a conversation reached the calendar. That is the stage to look at. A separate response-speed check explains part of it: only 6 of the 14 received a reply from a person within one business day. Response speed is a diagnosis tool and not a stage, so it sits beside the table. The traffic is not the problem, and buying more of it would only add more people to the same slow queue.
This guide gives no outside benchmarks, because rates vary widely by market, offer and list quality. Compare each cohort with your own last three. A stage that fell is a stronger clue than a stage that is merely low.
Which five checks find the leak along the path?
Each check below takes about ten minutes. Run all five in one sitting, write down what you find, and pick the worst.

Data: is the list still true?
Pull 20 contacts at random from last month's list. Check each person's job title and company on public sources such as the company website and LinkedIn. Count how many are wrong: the person has left, the title changed, or the company does not fit your target.
Twenty contacts is a small sample, so treat the result as a warning and not as a verdict. As a proposed internal rule, if five or more of the 20 are wrong, audit a larger sample of 100 before you change anything else. If the larger sample confirms the problem, the list is the leak, and a sharper message cannot rescue a list full of the wrong people. The threshold is a starting rule, not an industry standard, so adjust it after two months of your own results.
Outreach: do positive replies reach a person fast?
Open the inbox and filter the interested replies from the last 14 days. Count how many waited longer than one business day for an answer. This is the response-speed check for outbound replies. Then check where positive replies land. A reply that goes to a shared mailbox, or to a sending address nobody watches, is a lost meeting. For a full method, read the guide to cold email reply handling.
SEO and AI search: do the pages that get visits give a next step?
Open the landing page report in Google Analytics 4 and list your five busiest landing pages. For each one, ask two questions. Does the page answer the question that brings people to it? Does it offer one clear next step? A page with strong traffic and no inquiries has a page problem, not a traffic problem. Our B2B website conversion checklist lists what to check on each page.
Website: what does a buyer experience when they ask?
Fill in your own contact form from a phone, on mobile data, and note the time. Then watch what happens. Does a confirmation page say what happens next? Does the message reach an inbox someone watches? How long before a human replies, not an automatic message? This is the response-speed check for inbound requests. A form can work technically while the confirmation page says nothing and the first reply arrives the next afternoon.
Social: do conversations turn into records?
Search the last 30 days of direct messages and comments for buying words: price, cost, quote, call, demo, "how do I start". Count how many got a reply within a day, and how many appear in your CRM as a person with a note. A comment that never becomes a record is invisible to every report you own.
How do you learn which channel works when buyers do not click?
Add one required free-text question to your booking form and your first call: "How did you first hear about us?" Save the exact words in the CRM.
Tracking links show the buyers who clicked. A buyer may also read a post, hear your name from a peer, or see you named in an AI answer, and then type your company name into a search box. Analytics may record that visit as direct traffic or branded search. In GA4, direct traffic means that no clear referral source was found. It is not evidence of AI or social influence, and it is not evidence against it either.

The free-text answer adds information that analytics cannot show on its own. Treat it as a clue to cross-check against your analytics, not as proof. Once a month, sort the answers into five to eight groups, such as "LinkedIn post", "referral", "ChatGPT or Perplexity", "Google search" and "cold email". The answers are self-reported and imperfect, but they are more useful than a blank field. If AI answers are part of your mix, our guide to measuring AI search citations and pipeline shows how to connect those mentions to meetings.
What does a 30-day fix look like?
- Days 1 to 7: Write the three-line definition of a qualified meeting. Count the six numbers for last month's cohort, by source, using unique people.
- Days 8 to 14: Run the five checks. Pick the single stage with the biggest loss closest to the meeting, and name one person who owns it.
- Days 15 to 21: Fix that stage only. Test it end to end, for example by sending yourself a positive reply and timing how long it takes to reach the right person.
- Days 22 to 30: Update last month's cohort and start the new one. Compare the stage you fixed with the previous cohort. Write down one decision for next month.
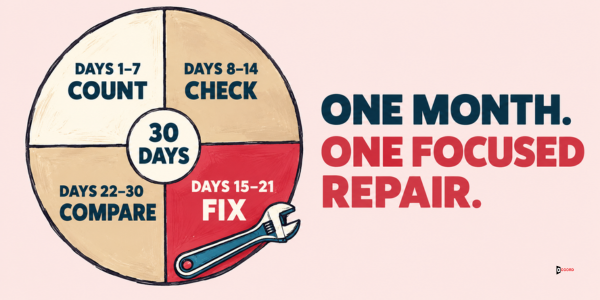
At the end of 30 days you have a count you can repeat, one repaired stage and a before-and-after comparison for that stage. If you want to see how data, outreach, SEO, web and social connect in one plan, read how data, outreach, SEO, web and social work together.
When is the problem earlier than the handoff?
Sometimes the six numbers point away from follow-up. Read them this way:
- Replies are near zero. The cause sits upstream: the list, the offer or the inbox placement of your emails. Fix those before you work on follow-up.
- Positive responses are fine but meetings booked are low. The cause is speed, a clumsy booking step, or too many back-and-forth emails. Offer two time slots and a booking link in the first answer.
- Meetings booked are fine but meetings held are low. Buyers forget or lose interest. Send a calendar invite with a one-line agenda, a reminder 24 hours before and another one hour before, and a rebooking link in each.
- Meetings held are fine but qualified meetings are low. The list or the message attracts the wrong buyers. Tighten the targeting rules and the promise in the first line.
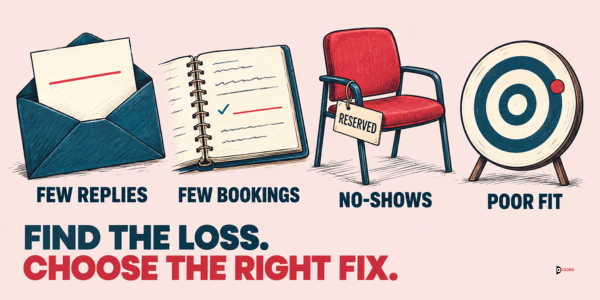
Each pattern has a different owner and a different fix, which is why one blended meeting count hides so much.
Frequently asked questions
Why are my B2B channels not producing sales meetings?
Often because each channel is measured on its own output and nobody counts the stages between a reply or a request and a meeting that is held. Track six numbers, from people contacted or asking to qualified meetings held, and find the stage with the biggest loss.
How many channels does a B2B company need?
As many as one person can own and measure. One channel with a working path to the calendar beats five channels that each stop at a report. Add a channel only after the six numbers show that the current ones deliver meetings.
What is a good reply rate for cold email?
This guide does not quote a single benchmark, because reply rates depend on the list, the offer and the sender reputation. Track your own reply rate for three months and treat a drop as the signal, not a number from another company.
Next step
If you would like a second pair of eyes on your six numbers, book a 30-minute working session with the Accord team: book a 30-minute working session. Bring last month's counts, even if some are rough, and use the time to pick the one stage to fix first.